


Q2 Sift Updates – Clearer Insights, Faster Resolution, Increased Revenues
The Sift product range is designed to grow with you. Part of this growth includes continual development of new, powerful features. We are always looking for ways to make the products better in response to your needs. With ongoing improvements, we’re excited to spotlight some of the latest changes and tick off things that have been on your wishlist.
|
|
Dig deeper into the data
Raw Data Studio
We’ve just launched our Raw Data Studio in Sift Monitor. This gives users powerful new tools to explore wind and solar data, allowing users to create custom plots, visualise performance signals, and dig deeper into the data in our Sift Monitor platform. Whether you’re diagnosing a performance issue or spotting subtle patterns, our data studio puts data exploration at your fingertips.
Get insights in seconds
AI Document Insights
Our new AI Insights tool now allows you to upload documents such as site reports, fault logs, OEM manuals etc. and generate instant, intelligent summaries right within the Sift Monitor platform. With this new feature you can get insights in seconds without reading the full report, summarise complex technical documents quickly and save time diagnosing issues. It’s perfect for users who need fast, reliable insights without information overload.
Estimate your energy loss
Task Value Calculation
We have updated the task forms in Sift Monitor to allow users to calculate the value of a task more effectively. Users can quantify the impact of operational tasks, including estimating energy loss tied to specific issues which can help to both prioritise work based on impact and understand the cost of inaction for unresolved tasks. By using this new tool, teams can take action and reduce avoidable losses.
Identify failures at a glance
Analysis Dashboard
We’ve re-designed the Sift Monitor home page to introduce a new dashboard view which gives you instant visibility of the status of your analytics. Now you can easily see which analysis ran successfully and identify failures at a glance. This new feature makes it easier to monitor your analytics pipeline, spot issues early, and keep your performance monitoring on track.
Bitbloom Updates
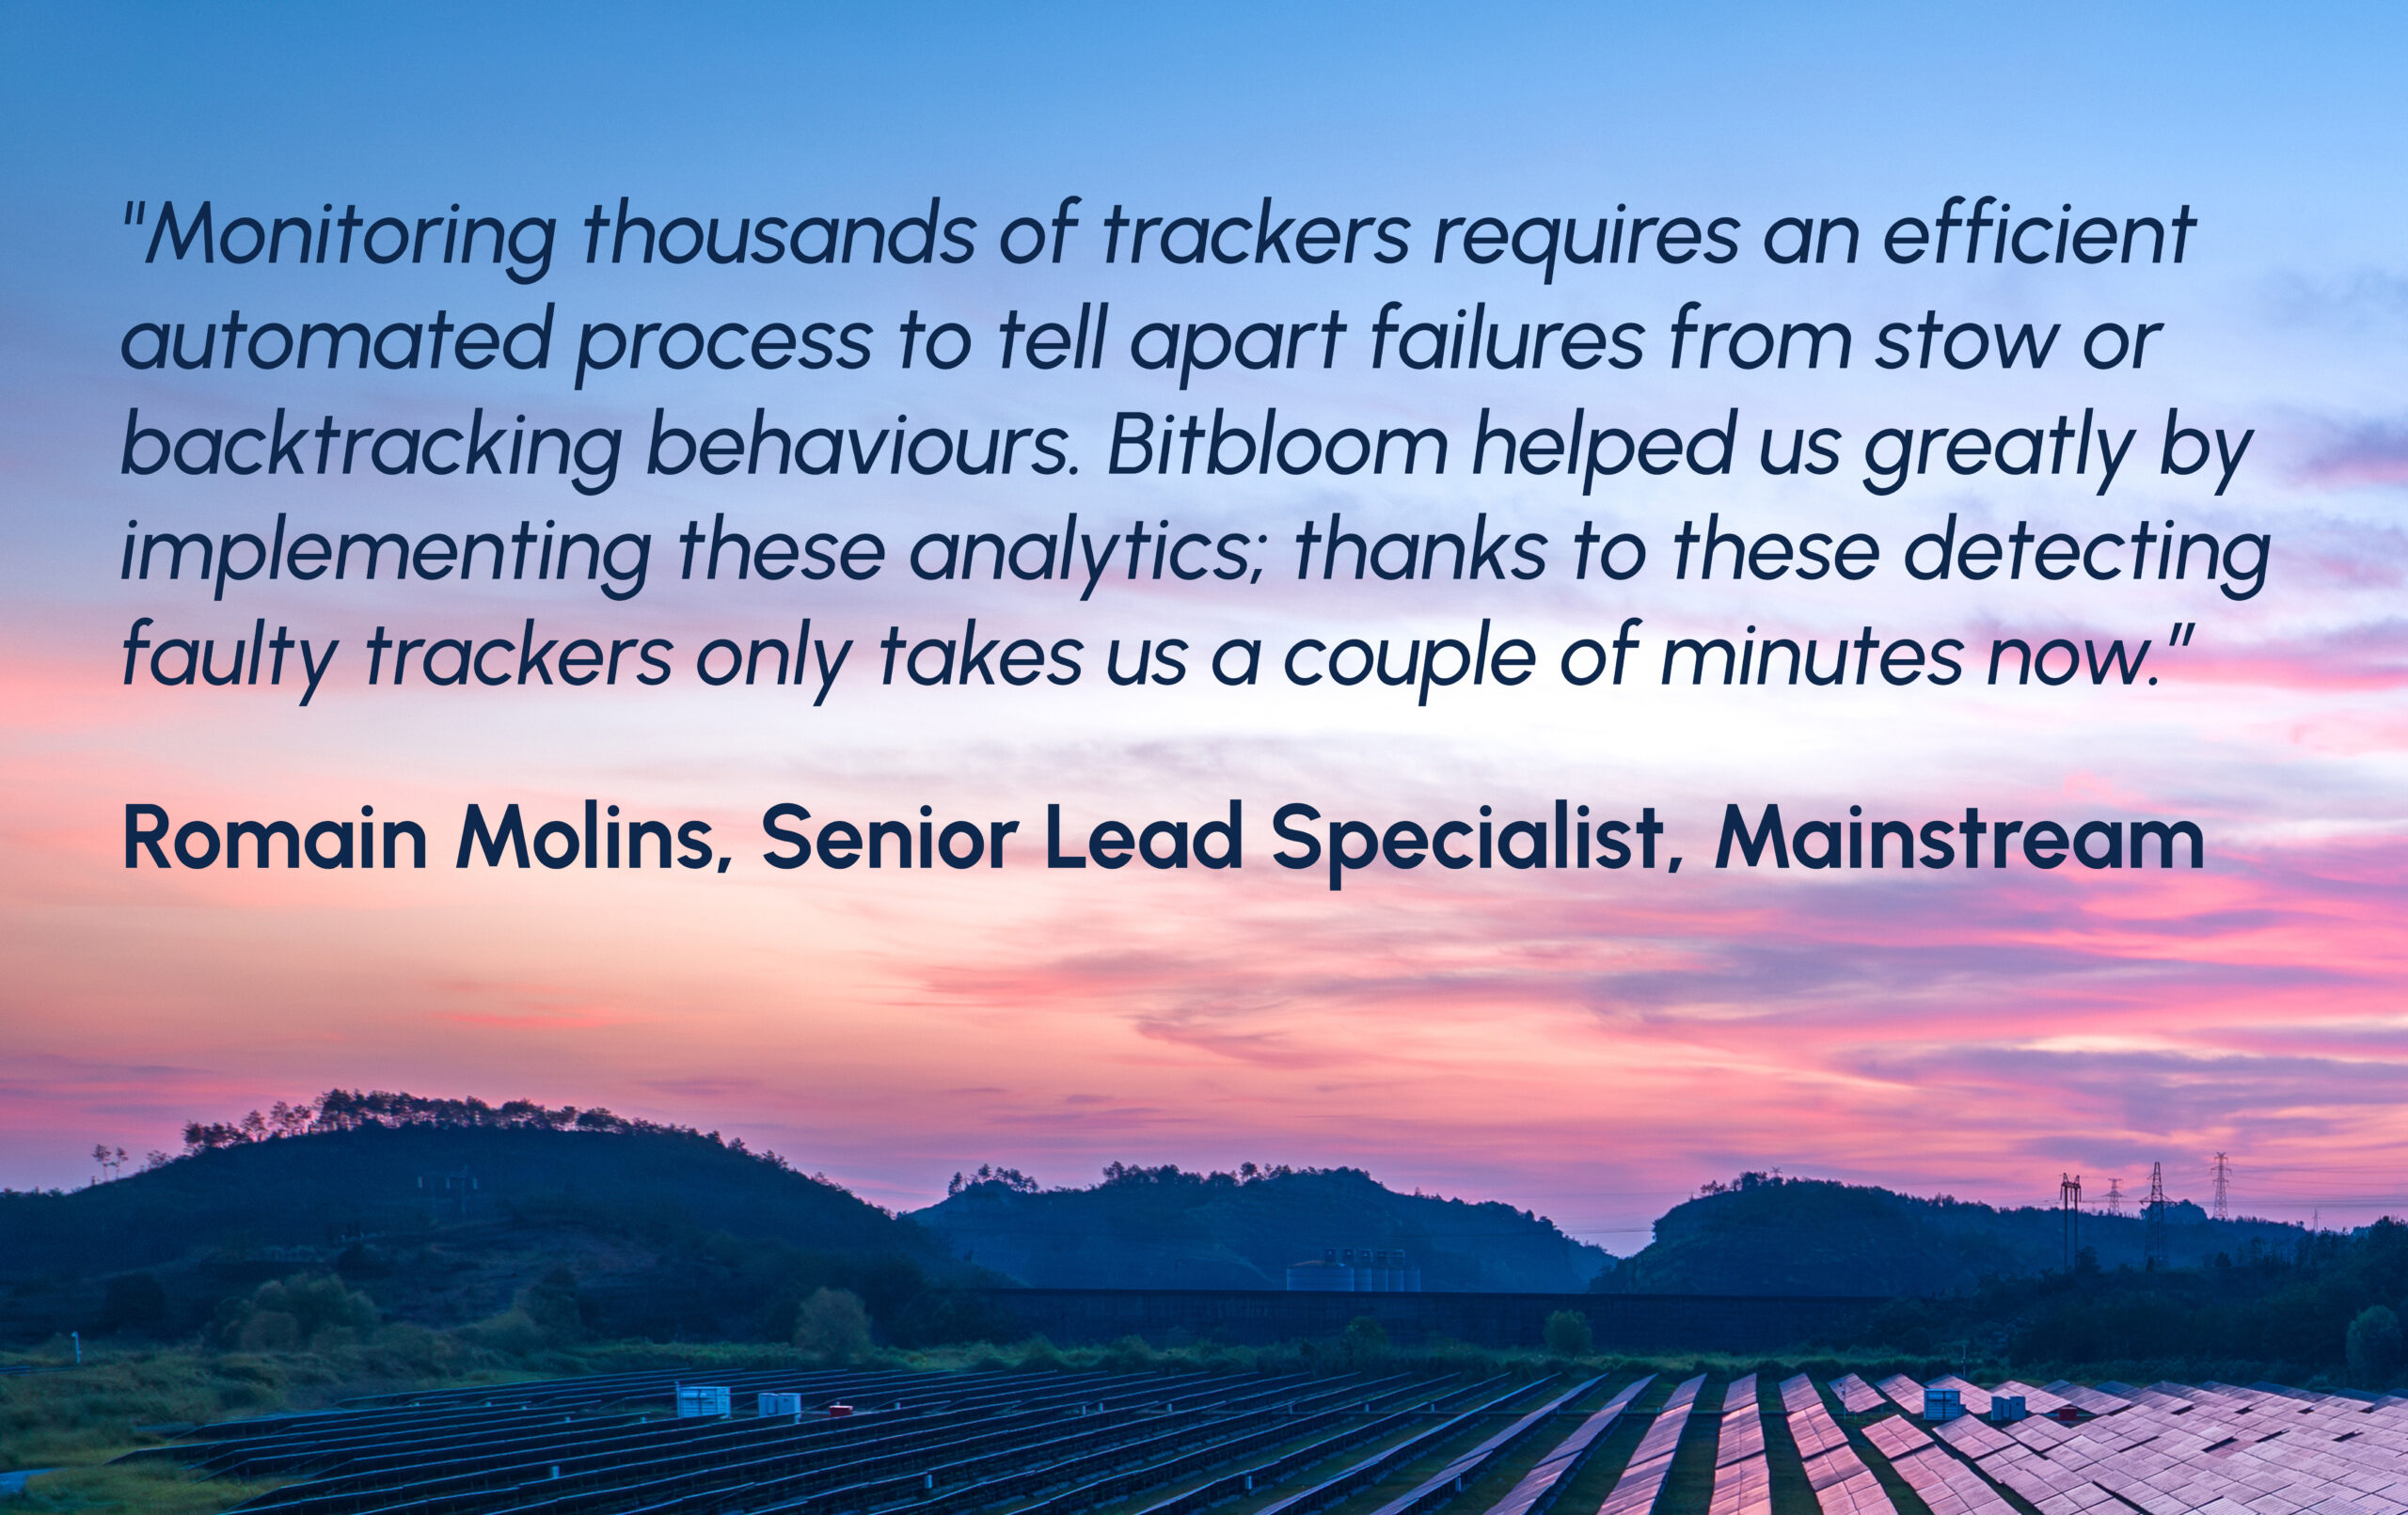
Solar Case Study Focus:
Monitoring Solar Trackers for Optimal Performance
Mainstream Renewable Power is a global developer of renewable energy assets. Bitbloom, a leader in renewable asset performance and condition monitoring, has been supplying its data analytics software, Sift, to enhance the operational efficiency of Mainstream Renewable Power’s assets in Chile, which total over 1GW and include three solar sites.
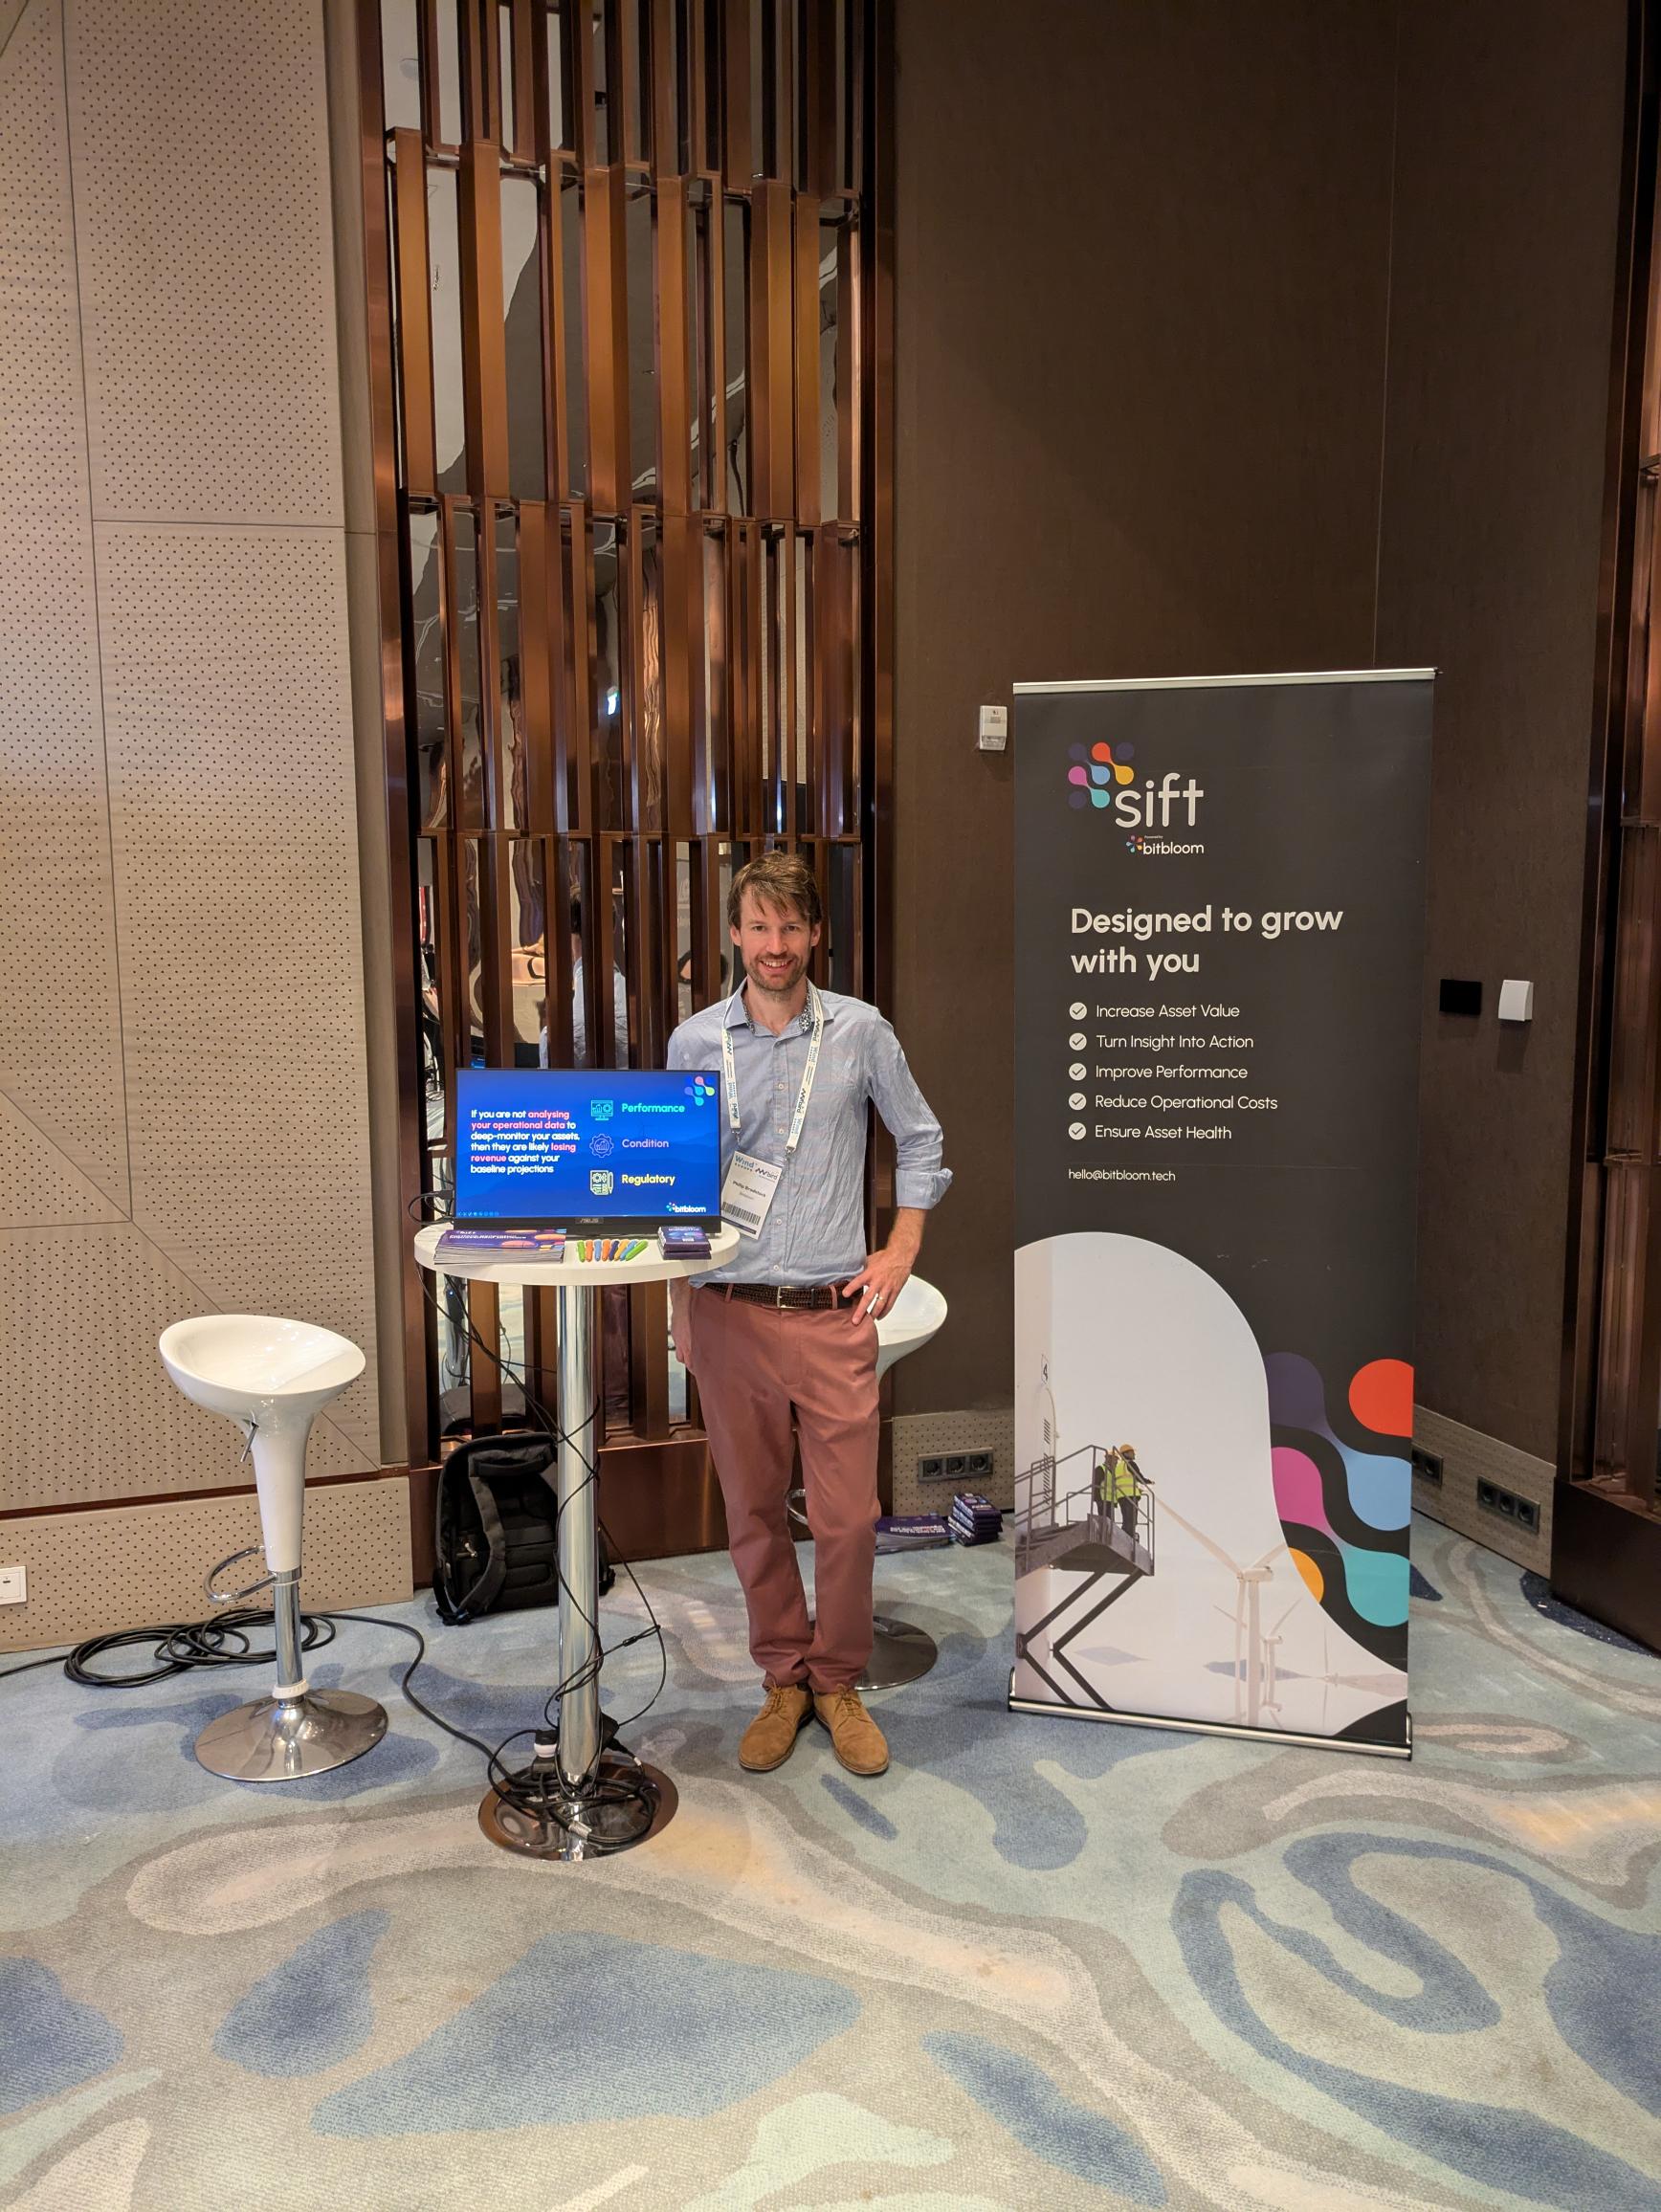
Upcoming events
Head of Analytics Philip Bradstock will be speaking at Offshore Renewable Energy 4.0, September 5 & 12.
You’ll also have the opportunity to talk to Philip and our Head of Sales Neil Pittam at Solar & Storage Live UK in Birmingham, September 23-25.
Reach out if you’d like to learn more about our custom scalable options and tailored solutions to match your portfolio needs!
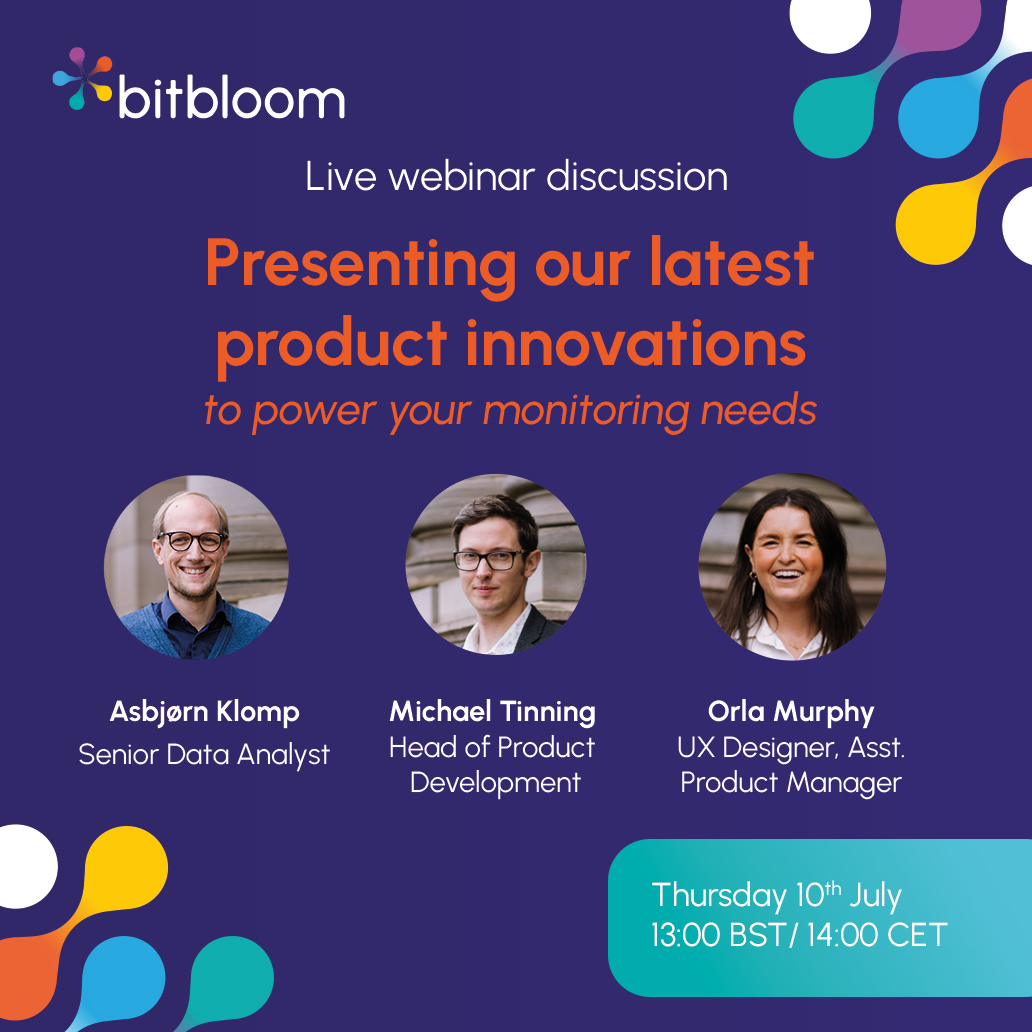
New Features Webinar
We recently introduced our New Features Webinars which you can rewatch on our Youtube channel. This series showcases our latest product innovations. We have another webinar on Thursday July 10th. Register here to join live:
Webinar: Presenting our latest product innovations to power your monitoring needs
Previous webinars can be accessed on our Knowledge Hub.

Catch up on Series 1 & 2 of Sift Tutorials
Bitbloom have launched two series of Sift tutorials which are available on our YouTube channel
Last year, we brought you the first Sift tutorial series which focused on deep dive analytics with our Sift Explore platform. This was an introductory video series for wind energy analytics. Our latest series focuses on our Sift Monitor platform in which our experienced analysts guide viewers on setting up and scaling analytics across a full portfolio.
Make sure to like & subscribe so that you don’t miss out on future series to come!
Find all Sift tutorials series in the link below:

We’re with you every step of the way
Find out how Sift can help your organisation bloom