Join us in building a brighter future.
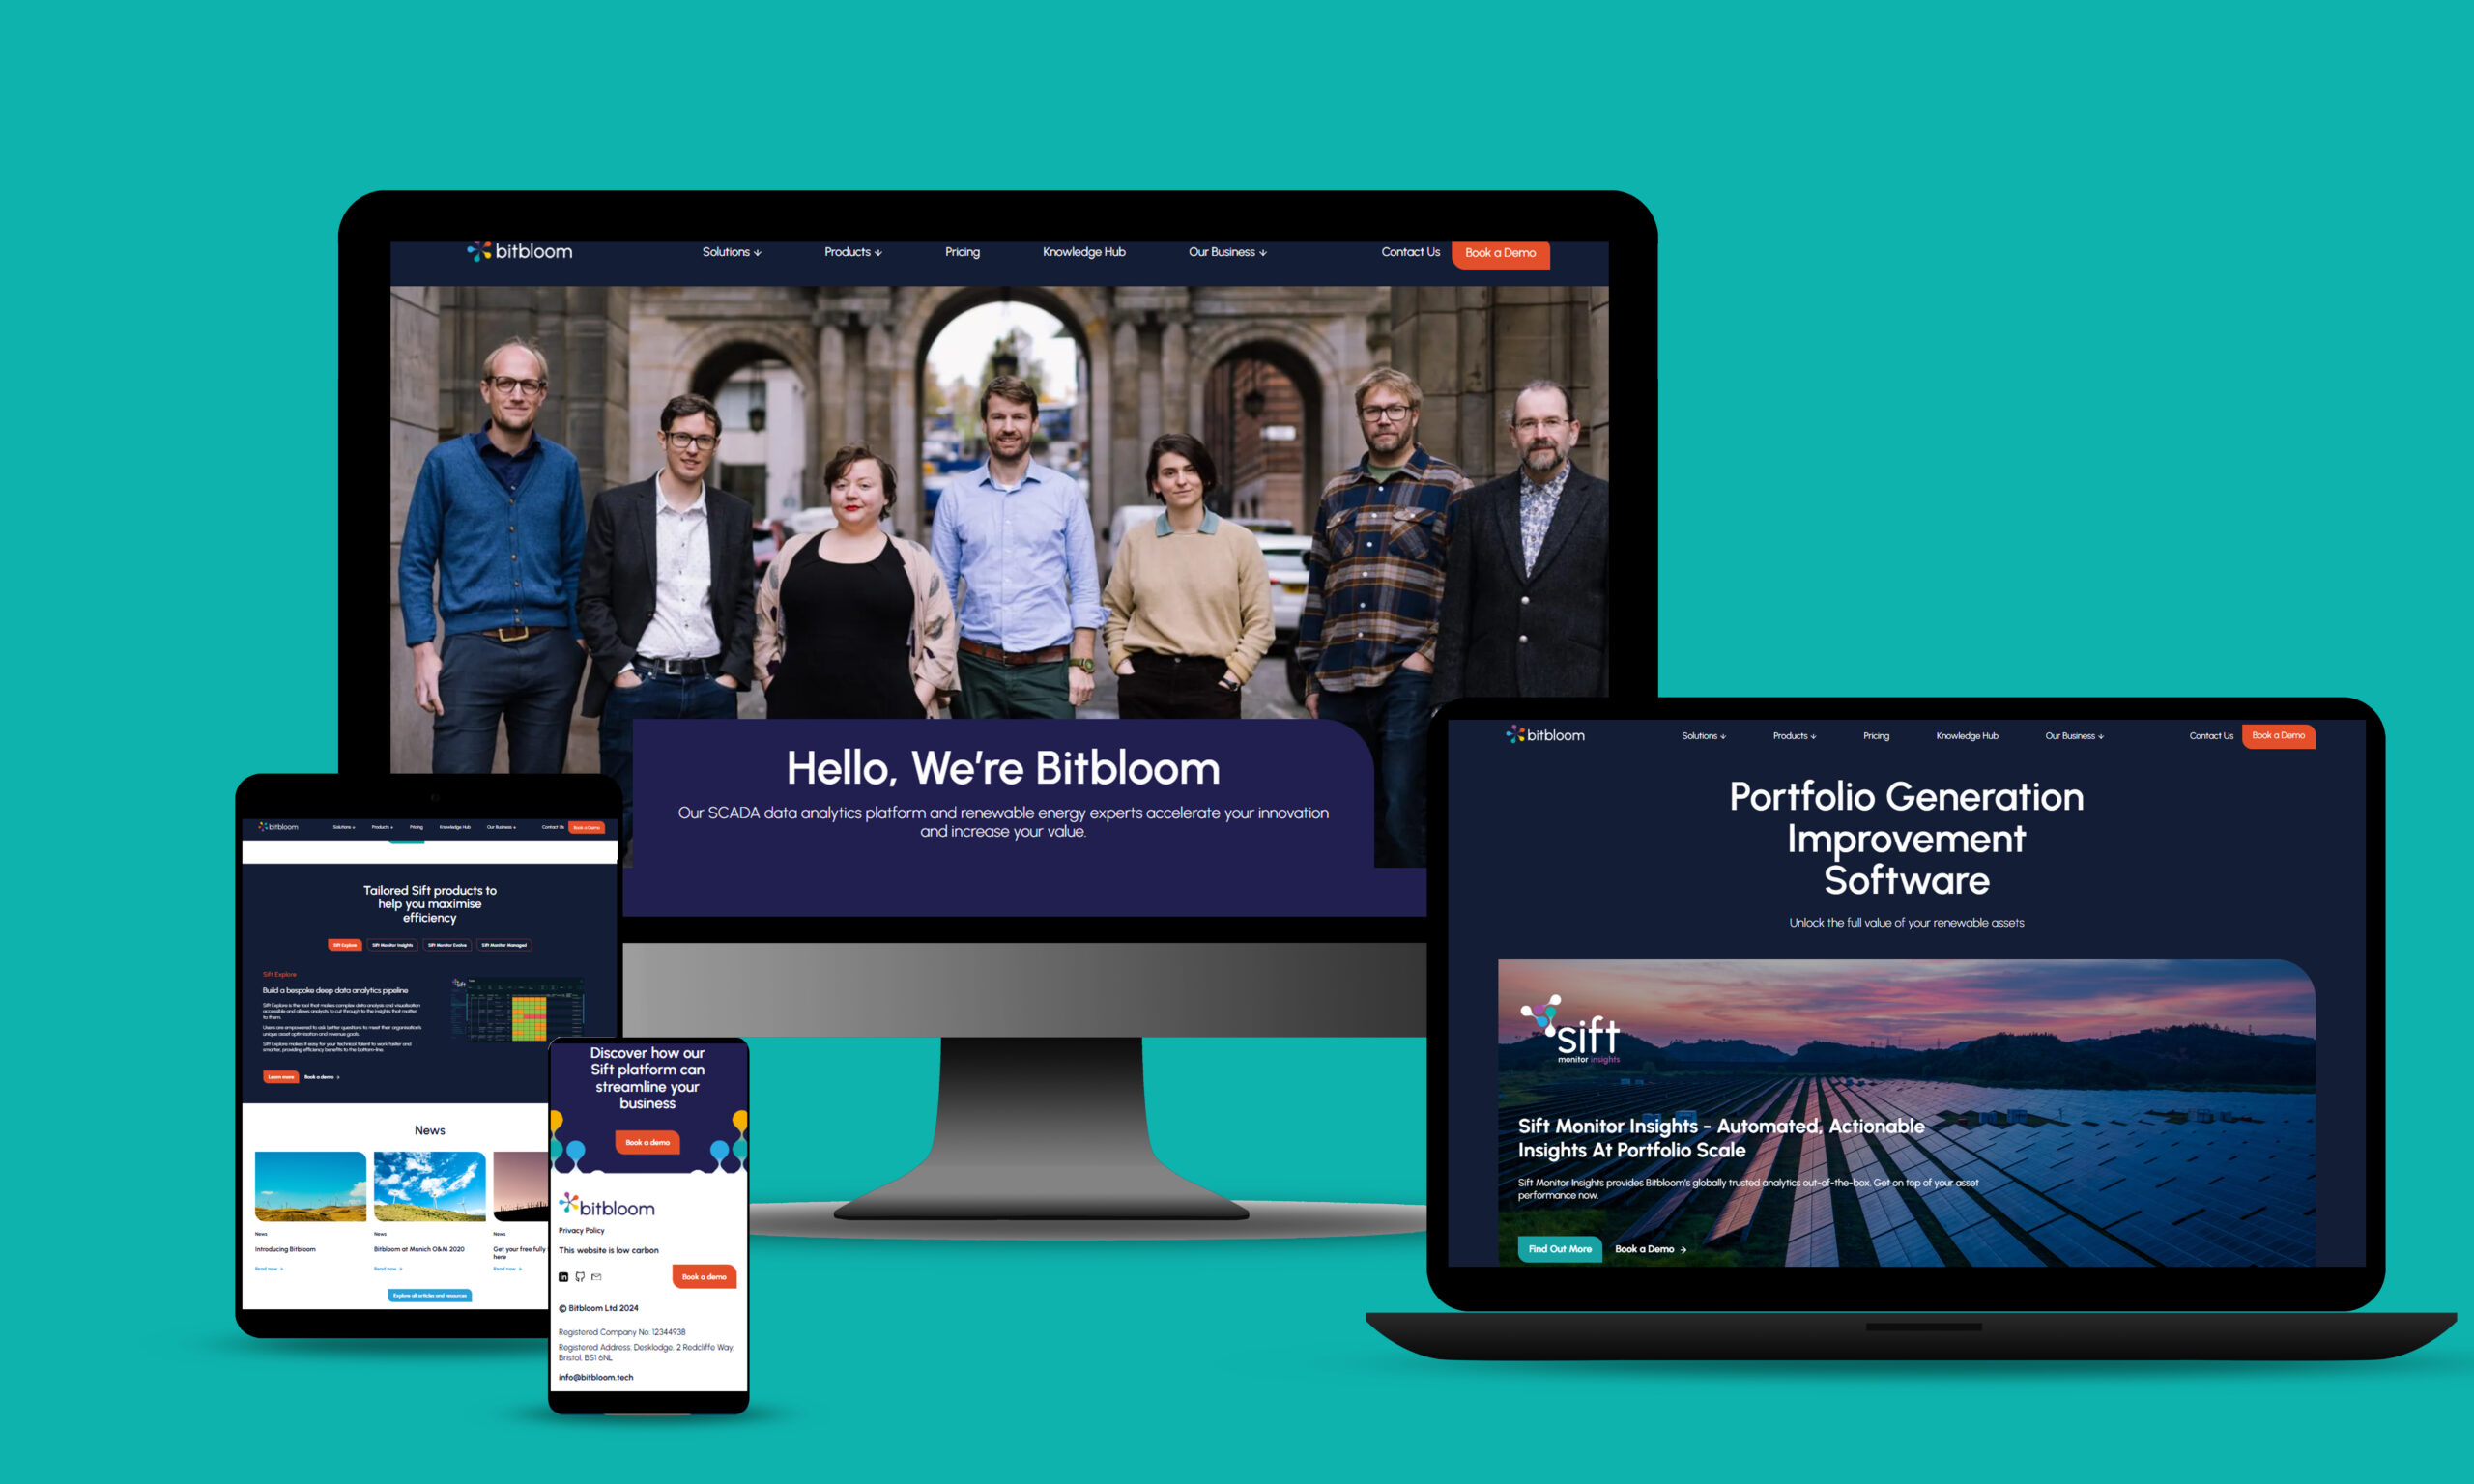
Bitbloom have launched a new low carbon website
Proudly Presenting Our New Website Design
Earlier this year we had a brand refresh from design & branding studio Hide the Shark led by StoryHook Master Toby Farrow which won a prestigious Netty design award.
We have re-designed our Bitbloom website using our new branding with more great work from Hide the Shark and Greig Cooke.
We’re optimizing your experience with Bitbloom alongside your renewable energy generation.
Q3 Sift Product updates
The Sift product range is designed to grow with you. Part of this growth includes continual development behind the scenes. We are always looking for ways to make the products better in response to your needs. With ongoing improvements, we’re excited to continue bringing you a quarterly newsletter to spotlight some of the changes we are most excited about.
|
|
Build your own unique insights
Scale your advanced analytics
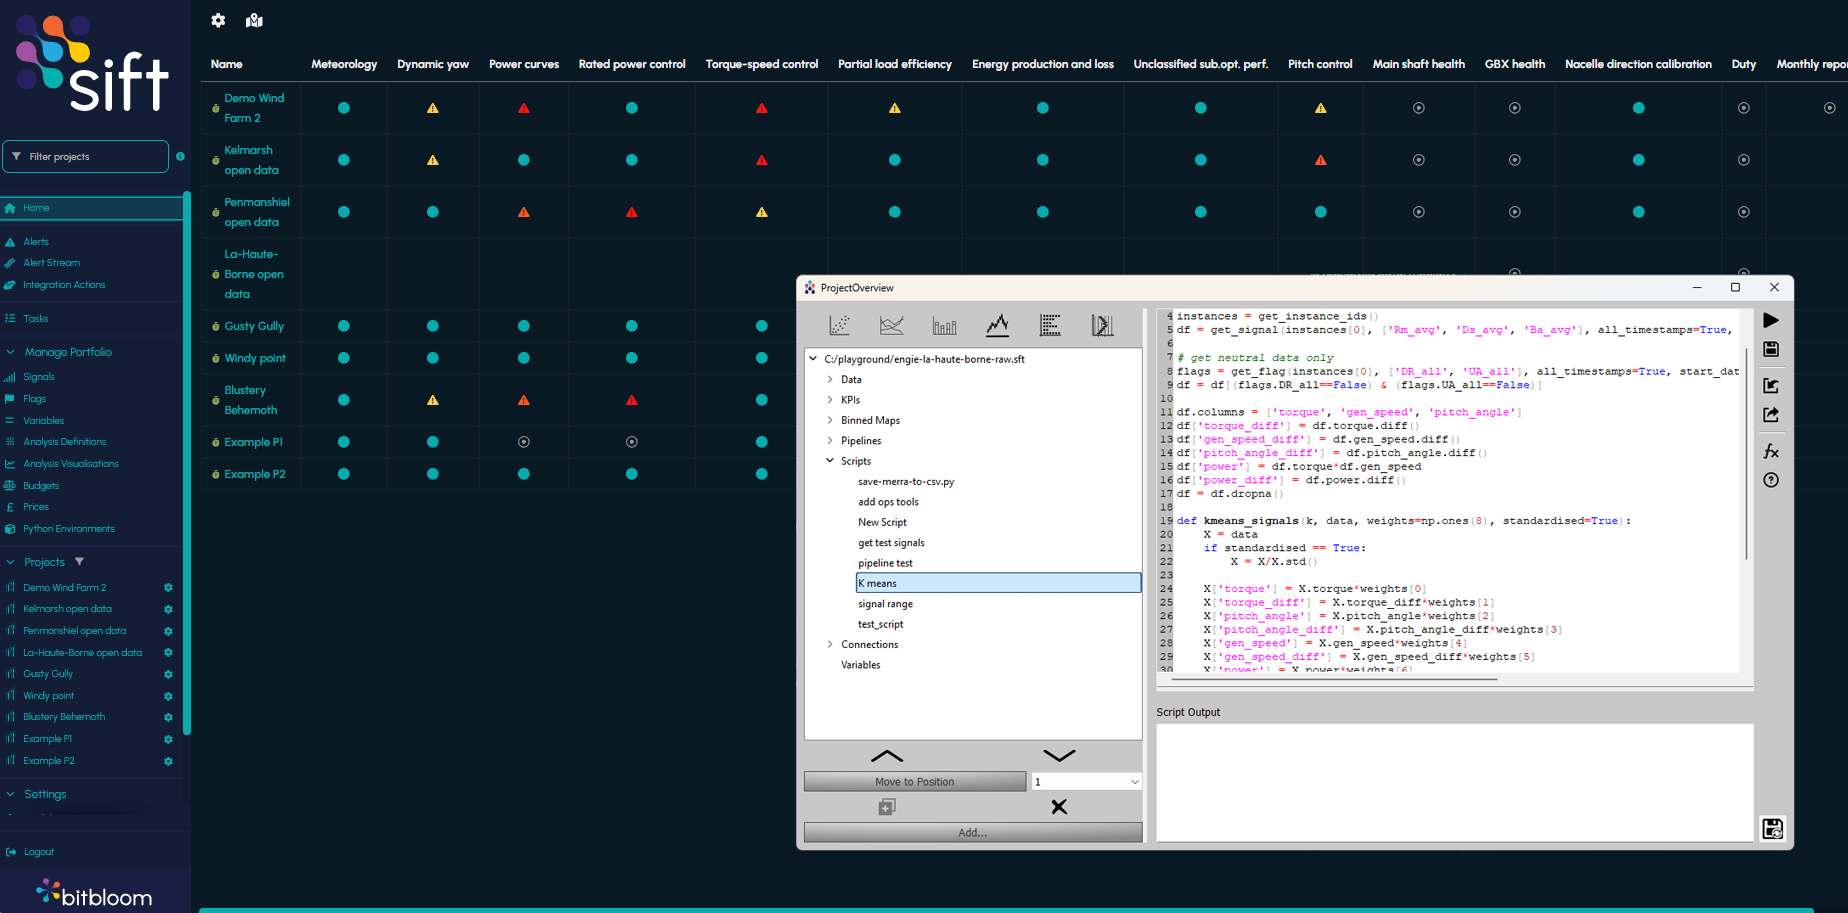
It is now easier than ever to go from idea to insight to action at portfolio scale. Use the Sift Python API to build your own unique insights and advanced analytics, then create visualisations and alerts across every site in your portfolio in just a few clicks.
Highlighting, zooming and more
New Plotting Features
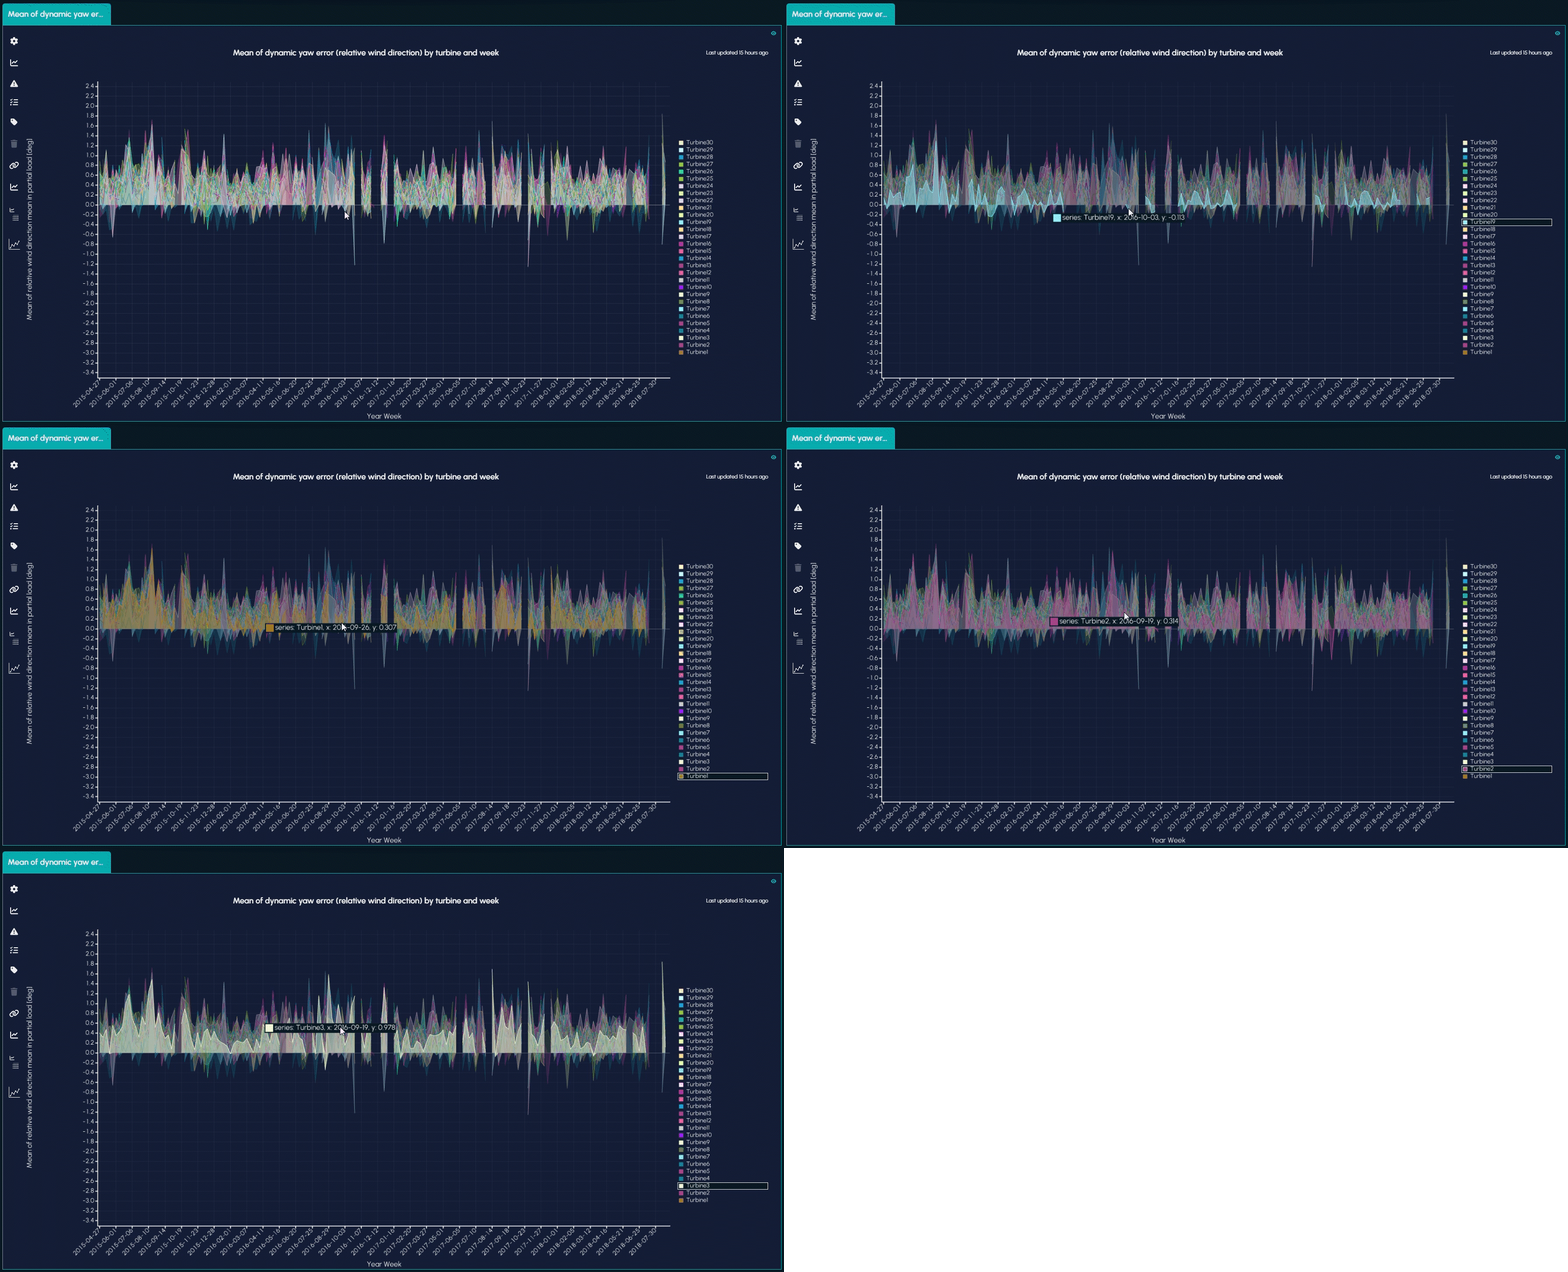
We have introduced the option to create radial plots on visualisations as well as other new plotting features including highlighting, zooming and more. These new plotting features can be activated through the profile settings and using the toggles under ‘Features’ to turn these on and off. These features allow users to visualise charts in new ways allowing them to highlight areas of the charts as well as turbines and improve the overall visual experience.
Better visibility of alerts
Home Page Dashboard
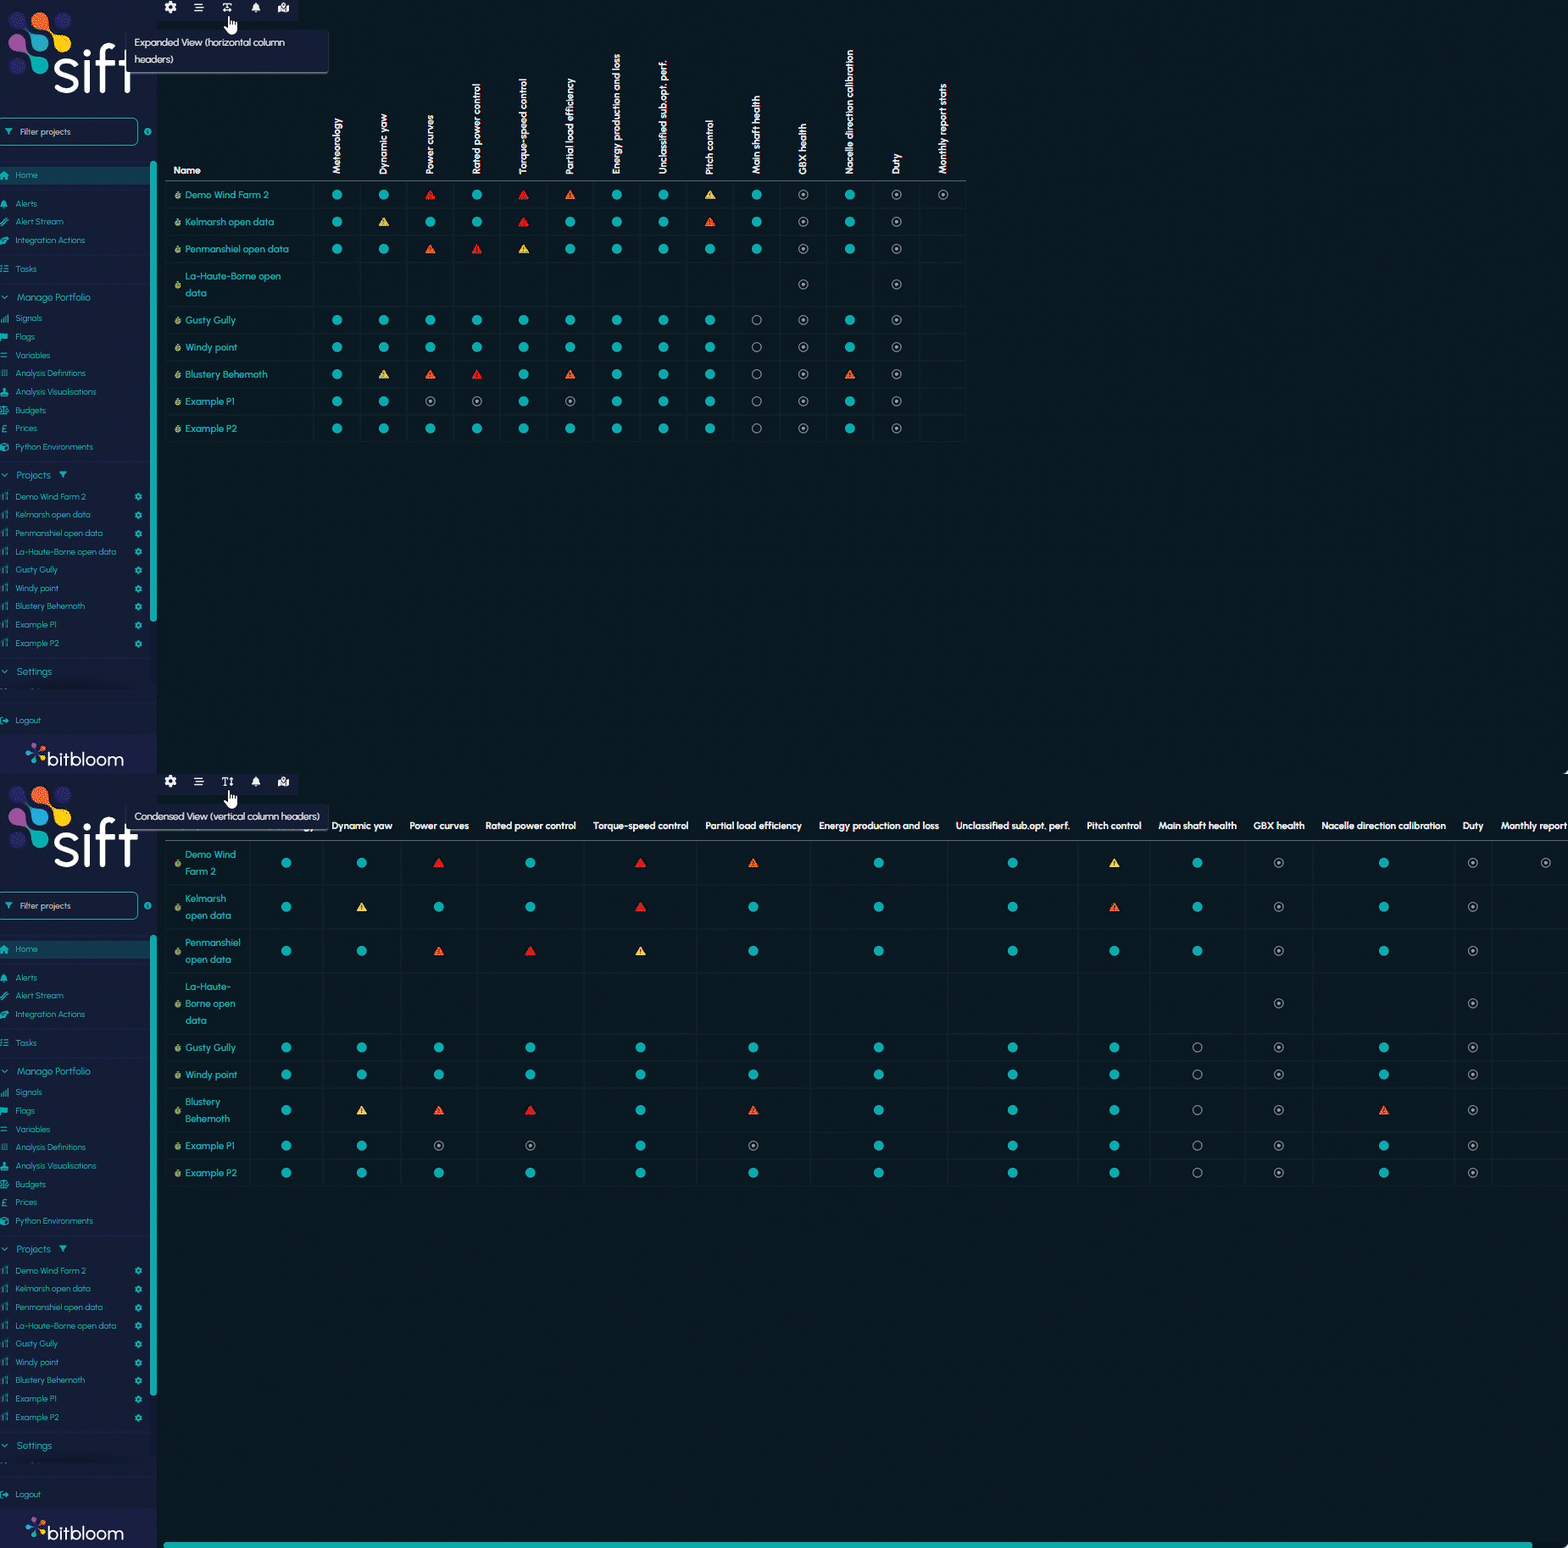
We have added a new feature to the Home page dashboard that allows you to condense the table to get better visibility of alerts across your portfolio.
Group multiple visualisations
Visualisation Bundles
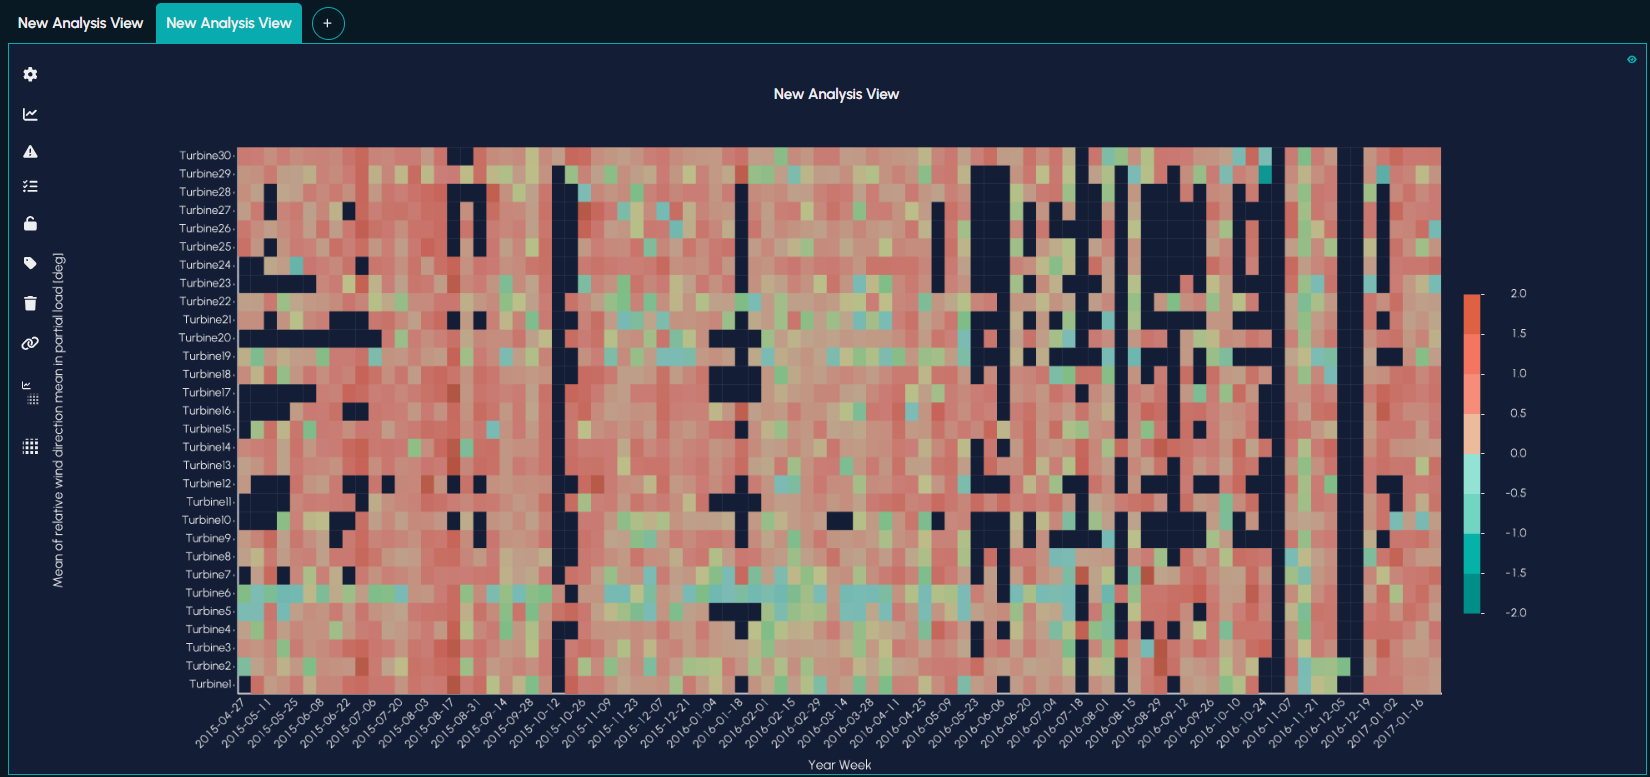
Our new bundle feature allows you to group multiple visualisations that are based on the same underlying data group, each accessed through the tabs. This means we can now better visually organise the analysis pages, making these pages shorter and less cluttered. A common example of the benefit of bundles is to show the time series of a metric as a first visualisation, bundled with related bar charts which are used for alerting on the tabs.
Webinars
We’re gearing up for another exciting webinar with our analysts Asbjørn Klomp and Judith Nève. Sign up coming soon!
In the meanwhile, did you know you can watch our previous webinars on demand?
Webinar: The analysis says something is wrong: what next?
Upcoming Events
WindEnergy Hamburg
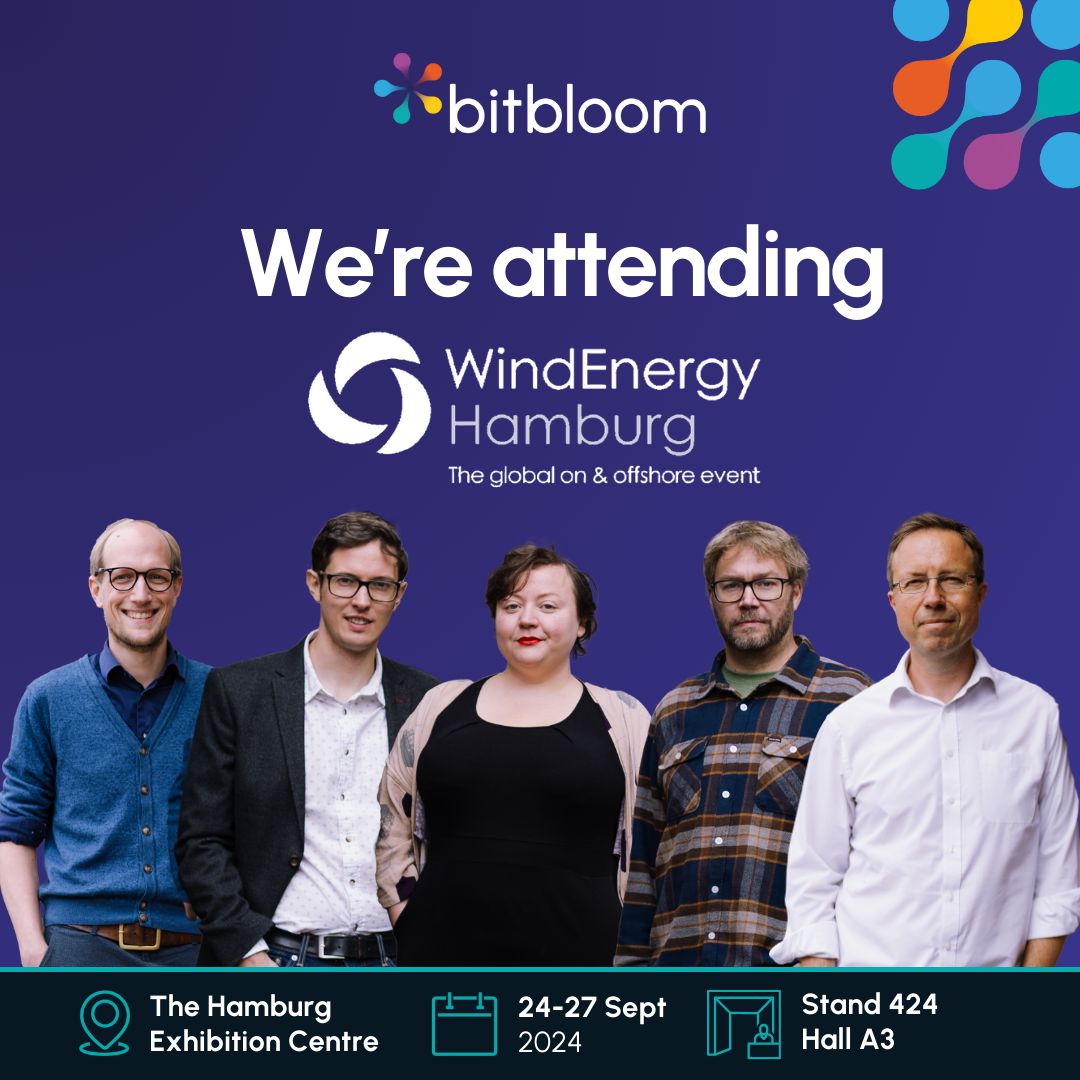
Bitbloom will be showcasing why we’re trusted globally by Renewable Energy experts at WindEnergy Hamburg September 24-27. You’ll be able to book in demos as well as learn more about custom scalable options to match your portfolio needs.
We’re also proud to have qualified as a sustainable exhibitor through STEP – Sustainable Trade Events Partnership.
Come see what we can do for you at our green stand: booth 424 in hall A3!
Retech
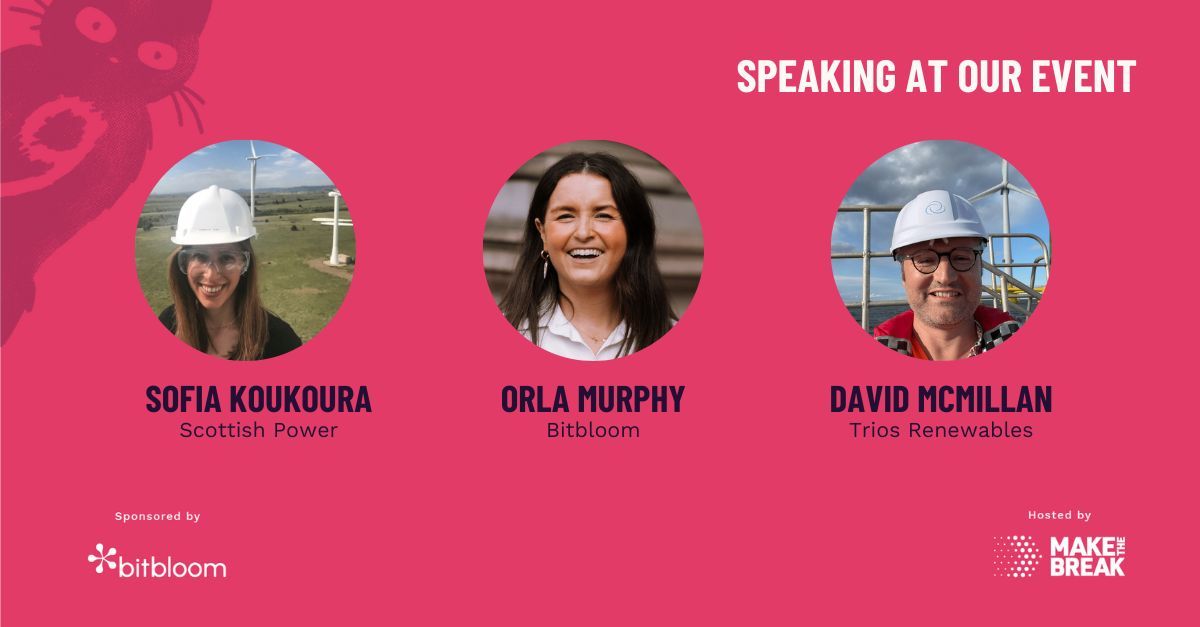
After hosting Re-tech’s Scottish debut earlier this year, we’re looking forward to bringing Re-Tech 9 back to Glasgow, Thursday October 24th!
Bringing together a community of problem solvers in Tech and Renewables over tacos.


Want to hear about the latest Bitbloom news & features?
Sign up to receive our newsletter straight to your inbox
We’re with you every step of the way
Find out how Sift can help your organisation bloom


